Data-DrivenUniversity Insights
Transform your university data into actionable insights with VersityLife's powerful analytics and reporting platform. Real-time dashboards, predictive analytics, and comprehensive reports for informed decision-making.
Comprehensive Analytics Platform
Everything you need to analyze university data, generate insights, and make data-driven decisions.
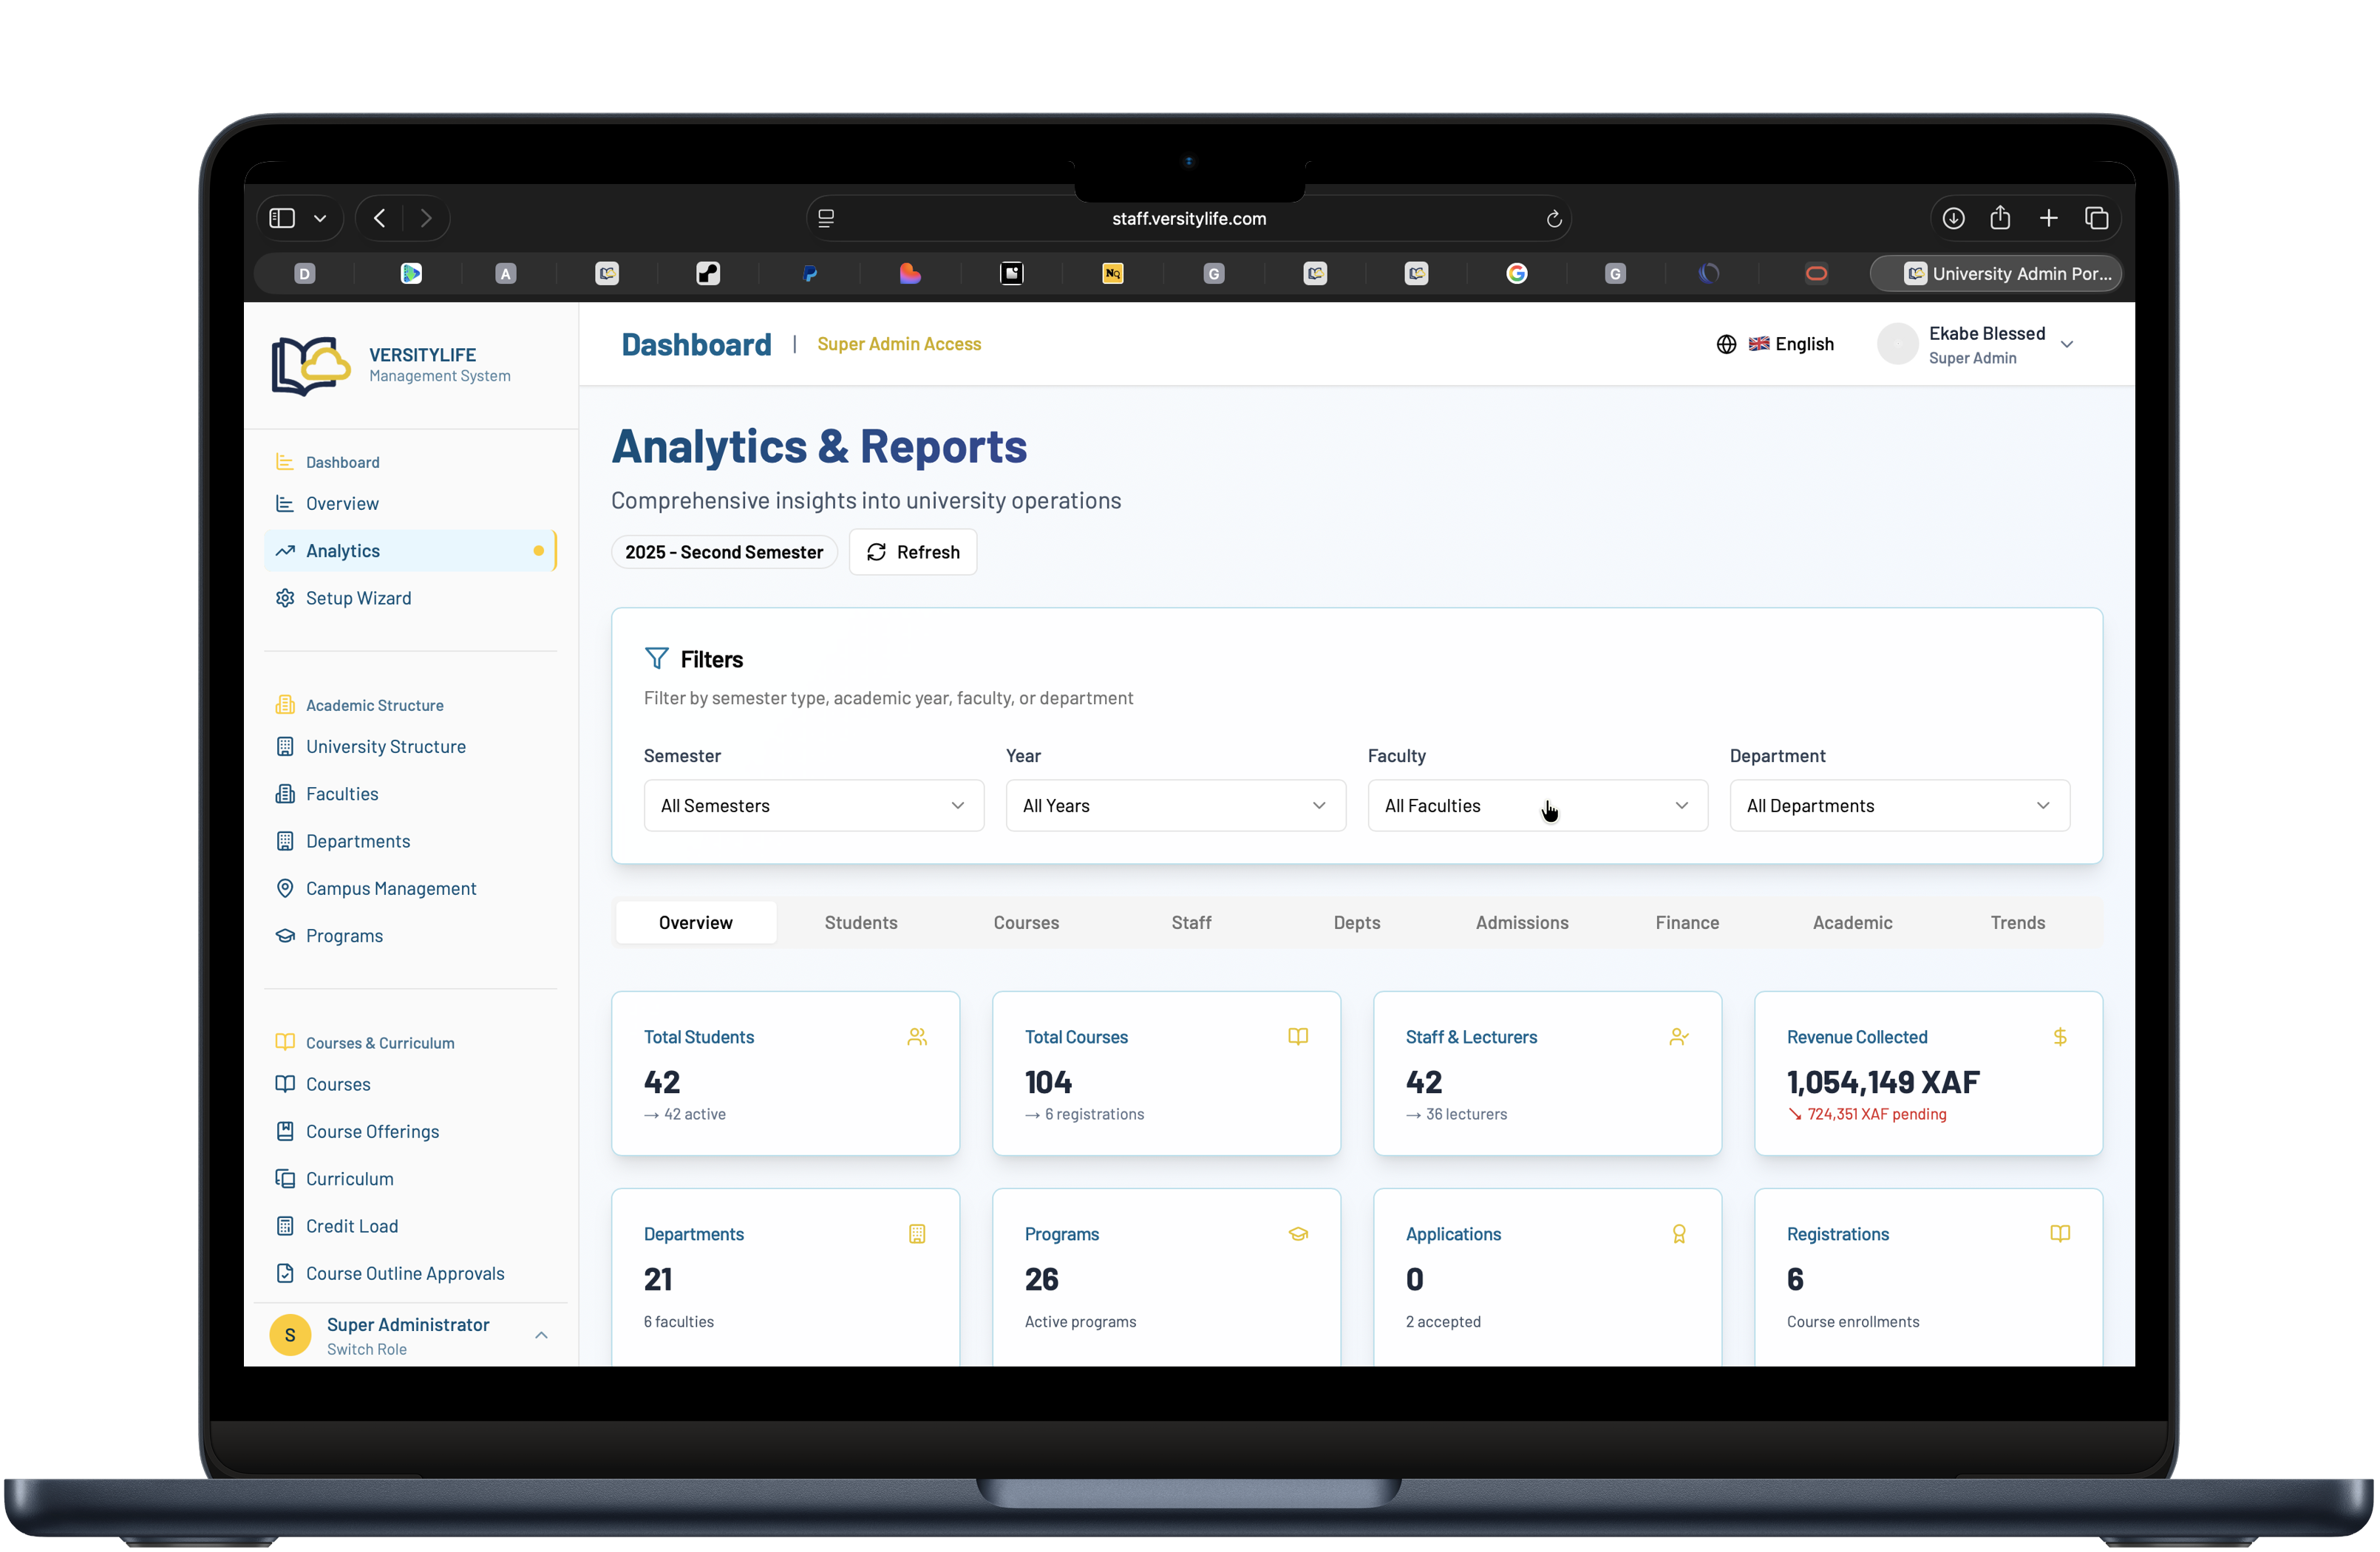
Real-Time Dashboards
Live dashboards with real-time data visualization showing key metrics, trends, and performance indicators across all university operations.
- Live data updates
- Custom dashboards
- Interactive charts
- Drill-down capability
- Mobile responsive
- Role-based views
Student Analytics
Comprehensive student data analysis including performance metrics, attendance patterns, retention rates, and academic progress tracking.
- Performance tracking
- Attendance analysis
- Retention metrics
- Cohort analysis
- At-risk identification
- Success predictors
Financial Analytics
Detailed financial reporting with revenue analysis, fee collection rates, budget tracking, and financial forecasting capabilities.
- Revenue analytics
- Collection rates
- Budget vs actual
- Payment trends
- Financial forecasts
- Profitability analysis
Enrollment Analytics
Track enrollment trends, application funnel, conversion rates, program popularity, and demographic distribution of students.
- Enrollment trends
- Conversion funnel
- Demographics analysis
- Program popularity
- Yield rates
- Capacity planning
Faculty Analytics
Analyze faculty performance, teaching loads, student evaluations, research output, and resource utilization.
- Teaching analytics
- Workload distribution
- Student evaluations
- Research metrics
- Productivity analysis
- Performance trends
Academic Performance
Detailed analysis of course performance, grade distributions, pass rates, academic standing, and program outcomes.
- Grade analytics
- Pass/fail rates
- Course performance
- Program outcomes
- Benchmark comparison
- Trend analysis
Predictive Analytics
AI-powered predictive models for student success, retention forecasting, enrollment prediction, and early intervention identification.
- Success prediction
- Retention forecasting
- Enrollment projection
- Risk identification
- Outcome prediction
- Intervention triggers
Custom Reports
Create unlimited custom reports with flexible filters, grouping, and formatting. Schedule automated report generation and distribution.
- Report builder
- Custom filters
- Multiple formats
- Scheduled reports
- Auto-distribution
- Report templates
Data Export
Export data in multiple formats including Excel, PDF, CSV, and JSON. API access for integration with external analytics tools.
- Multiple formats
- Bulk export
- API access
- Data warehouse
- Custom exports
- Integration ready
Why Choose VersityLife Analytics?
Built for Cameroon universities with features that provide actionable insights and comply with local reporting requirements.
Ministry Compliance Reporting
Pre-built reports that meet Cameroon Ministry of Higher Education requirements. Generate required reports with one click.
Real-Time Data Processing
No waiting for batch updates. See the latest data instantly as it is entered into the system across all departments.
AI-Powered Insights
Machine learning algorithms identify patterns, predict outcomes, and recommend actions to improve university performance.
Visual Data Storytelling
Beautiful, interactive visualizations that make complex data easy to understand. Charts, graphs, and infographics included.
Offline Analytics
Generate reports and view dashboards even during internet outages. Data syncs automatically when connection returns.
Benchmarking
Compare your university performance against national averages and peer institutions to identify improvement opportunities.